التداول المنهجي

تعليم التداول والتحليل الفني بأسلوب مبسط واحترافي.

A hand holding a smartphone displaying a stock trading chart with details on stock prices. The phone is above a wooden table where a blurred laptop screen in the background shows similar financial data. Natural light comes in from the window, creating a relaxed working environment.
استراتيجيات تداول

بناء استراتيجيات تداول ناجحة تساعد المتداولين على اتخاذ قرارات مالية ذكية وتحقيق أهدافهم في السوق.

A hand holding a smartphone displaying a colorful line graph with various candlestick patterns, indicative of financial or stock market data. The background consists of a textured, woven fabric surface in neutral tones.
تحليل فني

فهم التحليل الفني يمكن المتداولين من تحسين أدائهم وزيادة فرص النجاح في السوق المالية.

معرض

اكتشف استراتيجيات التداول وتحليل السوق بوضوح واحترافية.

A digital financial chart with green and red zigzag lines on a dark background, representing market trends. Below the main graph, there are smaller charts featuring bar indicators in red and blue, along with a yellow line graph.
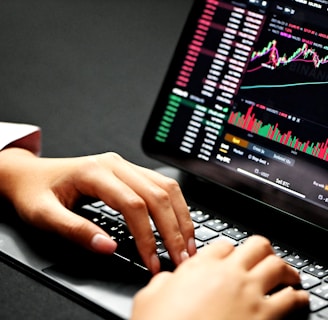
Hands typing on a laptop keyboard with a screen displaying financial graphs and stock market data. Multiple charts and numbers are visible, indicating online trading or financial analysis.
A hand is holding a smartphone that displays a stock market chart with various candlestick patterns and horizontal lines. The phone is held against a textured fabric background, which appears to be a sofa or carpet.
A person is using a MacBook Pro, viewing financial trading information from Questrade. The screen displays detailed trading data and an app interface, emphasizing connectivity and accessibility. The image features a modern setting with a couch in the background and some houseplants.
A hand holding a smartphone displaying a cryptocurrency trading application. The screen shows a candlestick chart for BTC/BUSD with a price of 36,437.00, as well as other information like the order book, market history, and margin data. The background has a two-tone color scheme with blue on the left and light gray on the right. The person is wearing a pinkish-red long-sleeve shirt.

تعليم التداول

اكتشف منهجيات التداول والتحليل الفني بأسلوب مبسط واحترافي. انضم إلى يوسف اليعقوب وتعلم كيفية بناء استراتيجيات تداول ناجحة واتخاذ قرارات مالية ذكية. محتوى عربي واضح يساعدك على فهم السوق بشكل أفضل.

50$
A person is using a smartphone to view a financial market chart. The screen displays a candlestick chart with green and red bars, likely indicating cryptocurrency or stock prices. The person appears to be seated, wearing casual clothes like shorts and holding the phone in both hands.
A laptop on a table displaying a cryptocurrency trading platform. The screen lists various cryptocurrencies along with their buy and sell values, spread percentages, and 24-hour change percentages. The keyboard and touchpad of the laptop are visible, set against a neutral background with a sofa in the back.

استراتيجيات ناجحة

تعلم كيفية بناء استراتيجيات تداول ناجحة مع إشراف المهندس يوسف اليعقوب. احصل على أدوات التحليل الفني اللازمة لتحقيق أهدافك المالية. انطلق في رحلتك نحو النجاح في عالم التداول مع محتوى عربي متميز.

75$